This projection uses a start date and a number of issues to deliver to forecast delivery dates.
Psst! A higher number of issues can be used to consider discoveries and new findings along the way.
This forecast is based on a Monte Carlo simulation. The historical throughput of the last three months is used to forecast; therefore, a more stable throughput can increase predictability and lead to more accurate results. Note that issue size does not impact the results.
Want to learn more about our projection logic? Check out this help article!
To estimate a delivery date
- From the interface of your project, access the projection module.
- This projection is located at the top of the page.
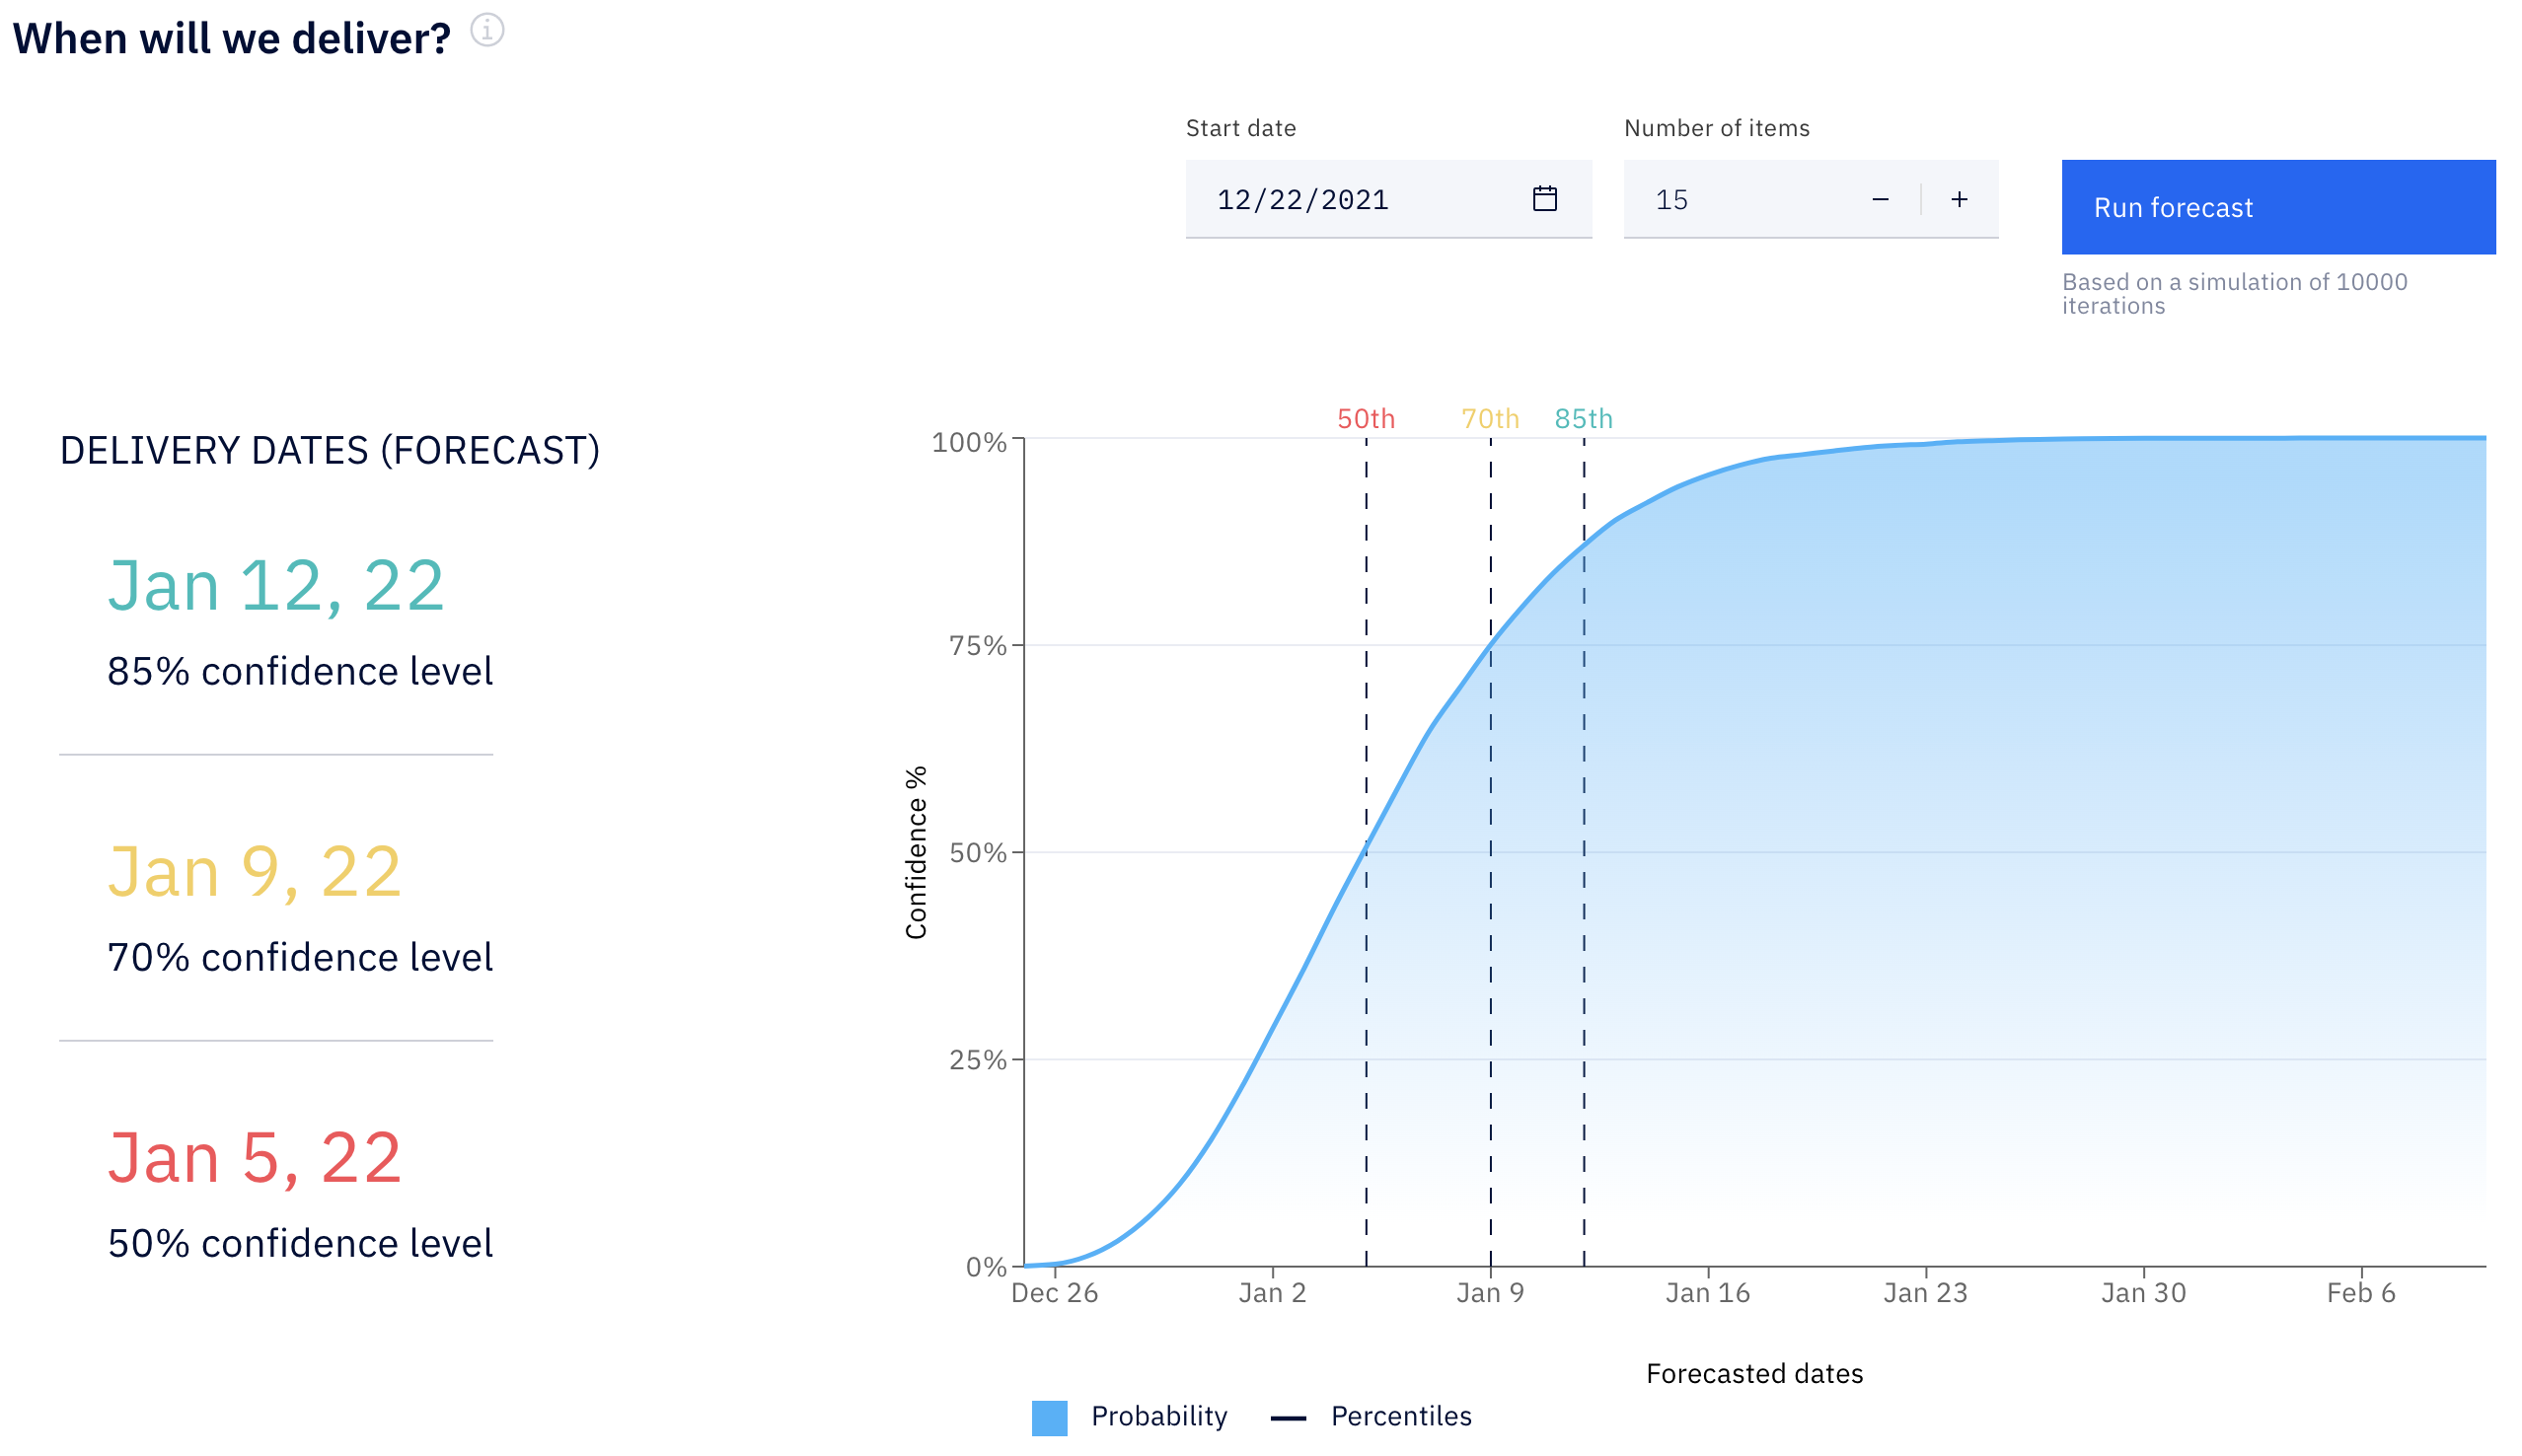
- In the Start Date field, enter the date you want the work to start. You can enter the date in MM/DD/YYYY format or select the date from the calendar that will display after clicking in the field.
- In the Number of items field, enter the number of items to be delivered. You can enter the number manually or use the - + buttons to increase or decrease the number.
- Once you have entered the data, click on Run Forecast. The simulation will run 10,000 iterations, which may take a few seconds.
- To the left of the chart are three measures for potential delivery dates.
- 85% confidence and the date will be displayed in green
- 70% confidence and the date will be displayed in yellow
- 50% confidence and the date will be displayed in red
- As for the graph, it shows a progressive increase in probability over time (blue line) as well as the percentiles corresponding to the dates seen on the left (vertical dotted line). Since it is interactive, you can hover over the graph with your mouse to get more information on the potential delivery dates.
For example, suppose we need to deliver 15 items, and we want to estimate the potential delivery date corresponding to 95% of confidence. We can hover over the blue area and discover that the forecast estimates delivery on January 16, 2022, instead of January 12, 2022.